Navigation Slider

On each training, you can replay the training. On the map, you can see the point symbolizing the horse and his parameters on the right side of the screen evolving.
Move the cursor (1) along the scroll barre if you wish to find a specific point of interest. Press play (2) and pause if you want to see the point moving forward and the evolution of the data on the right side of the map. When the training is in reading mode, a barre symbolizing the progress moves along the curves and the intervals of the split times table highlight in red when progressing.
The speed curve
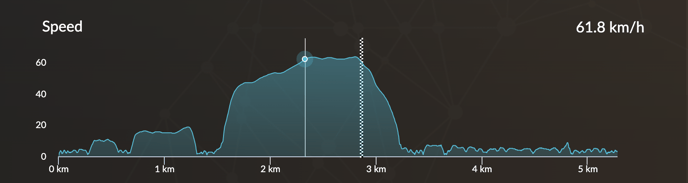
You can analyze the evolution of speed, acceleration, and deceleration. The speed curve is interesting to analyse and compare with the cardio curve (check the article about heart rate and recovery). On the curve, click and drag to select a specific moment. A zoom is made so that you can observe a more precise part of the training.
Split times table
For a more precise analysis of speed, you can refer to the sectionals. Thanks to the sectionals table, you can analyze the average speed on each interval (every 200m for instance). You can set up the parameters you want on the table so that it utterly fits your needs (see the article about Sectionals table to know more about it).
To go deeper in the speed analysis
Dive into our specialised White Book : What can data bring to your speed work ?