Four key steps to follow:
- Qualify the training
- Look at the key parameters
- Analyze the recovery with the HR curve
- Study the split times
1. Qualify your trainings
In order not to get lost in the data, it is important to qualify training sessions to avoid comparing what's not comparable. In fact, it is irrelevant to compare data from a short canter with the one of a very intense training. To compare two training sessions, they must have the same intensity and the same conditions. Notes can be added to remember, for example, which horses ran with which horse.
See how to edit your trainings on the Web Platform : click here
See how to edit your trainings on the Equimetre App : click here
2. Look at the key parameters
These are the main information to remember from the training. This first table gives an idea of the horse's fitness.
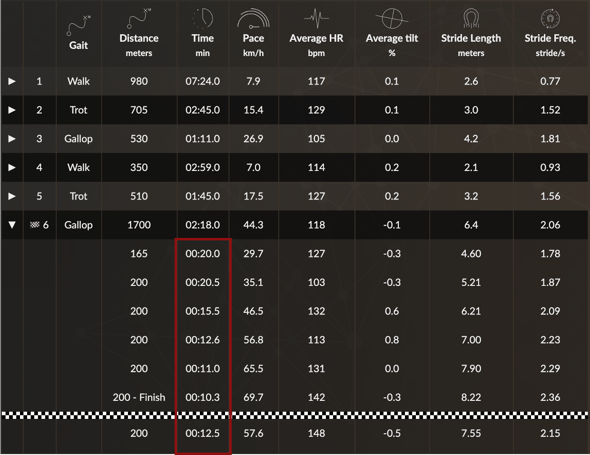
- Key speed parameters: max speed, best 600m, best 200m.
NB: During the race, the times on 200m are around 11-12s, on 600m around 35-36s. - Key cardio parameters: max HR, after the effort, after 15 minutes of recovery. A well-assimilated training will show low levels of HR.
NB: passing the 55% of max HR mark after the effort, and the 45% of max HR mark at 15 minutes gives an idea of the correct recovery.

3. Analyze heart rate and recovery more in depth
The third step consists in reviewing the 4 different heart rate zones of the training to assess your horse's fitness and ability to hold his effort.
1. Training area : Speed and heart rate are high. It allows you to quantify the effort of the horse during effort based on his maximum heart rate.
See more on how to interpret heart rate zones : How to read heart rate zones
2. Deceleration area at the end of work : speed decreases but heart rate remains high. This gives you a good idea of the intensity of the effort. The shorter this zone, the better the horse's recovery.
3. The fast recovery phase : speed is significantly reduced and so is the heart rate. This qualifies the recovery immediately after the effort.
Reference values for the analysis of fast recovery (good indicator of the intensity felt by the horse):
| Quality of the recovery | Level of HR corresponding (for information) | Details |
|
Bad |
> 64% | The horse recovers with difficulty (young horse for example). Very intense work for the horse. |
| Poor | 58% - 64% | The exercise was intense for the horse |
| Fair | 52% - 58% | Good intensity work for the horse |
| Good | 49% - 52% | Moderate intensity work for the horse |
| Excellent | < 49% | Easy work for the horse |
4. Recovery at 15 mins (D): speed is considerably reduced and heart rate decreases slowly. This provides us with information on fitness.
Reference values for the analysis of the recovery after 15 minutes (good indicator of fitness):
| Quality of the recovery | Level of HR corresponding (for information) | Details |
|
Bad |
> 53% | The horse recovers with difficulty (young horse for example) |
| Poor | 49% - 53% | Hard recovery |
| Fair | 42% - 49% | Recovers correctly |
| Good | 37% - 42% | The horse is recovering well |
| Excellent | < 37% | The horse is perfectly able to recover |
These parameters allow you to read each training session and evaluate your horse's recovery and physical condition in order to know if it is ready to run a race.
Learn more on the analysis of heart rate and recovery : How to analyse heart rate and recovery ?
4. Assess speed skills
The last step in reading a training session is to analyze your horse's speed using the sectionals table.
The analysis of split times during training is a useful tool to help you make the decision to enter the race. Indeed, it allows you to know if a horse is ready for a target race.