1. Calculating reference maximum heart rate
The reference maximum heart rate (or FC Max ref) corresponds to the maximum number of beats per minute that a horse's heart can reach during exercise. This maximum heart rate is specific to each horse. It decreases slightly with the age of the horse and is very little influenced by training. Moreover, it is not correlated with a horse's level of performance. During the same race, it has been shown that the maximum recorded heart rate of horses varies from 204 to 241 BPM (Evans, 2007). In order to better understand your horse's work and get him to work at his own specific heart rate ranges, you need to assess his maximum heart rate.
With statistical studies we have found that, on average, horses reach their maximum heart rate when their best 600m are under 42s.
So, for EQUIMETRE, maximum heart rate is defined according to the number of training sessions that have been carried out with a 600m section covered in less than 40s.
- If we only have 1 or 2 trainings, in less than 40s for the best 600m, the maximum of the different max HR reached during the trainings is used.
- If we have 3 or 4 trainings, the average of the two highest max HR is used.
- If we have 4 trainings or more, the median of all the max HR is used.

Find your horse's individual reference max heart rate in his profile or directly on his training pages (see photo above).
2. Recovery calculation
EQUIMETRE recovery data is calculated using a model. In other words, we use an equation to represent the recovery curve after exercise. The use of an equation makes it possible to limit the influence of random variations which may be due to stress or poor local measurement, or to ignore the active part of recovery when there is one.
To calculate the model, a certain number of points are required. Thus, 8 min of recovery are required to calculate the recovery parameters. If a significant increase in heart rate is detected, the points are excluded. Heart rate outliers are also excluded from the calculation.
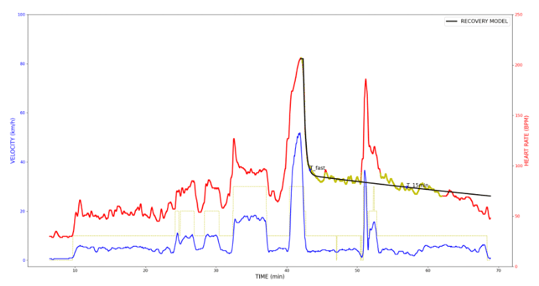 Recovery calculation model
For the parameters that define recovery time to 120 bpm and to 100 bpm, no model is used. They are defined as the time between the end of exercise and the first point that crosses the 120 bpm line, for example. For bpm at the end of the session, they are given as the lowest value recorded after exercise.
3. Breakdown of recovery
We classified the works in relation to each other and established groups. Based on this breakdown, recovery quality thresholds were defined as follows:
Fast recovery
| < 49% | Very good |
| 49% - 52% | Good |
| 52% - 58% | Fair |
| 58% - 64% | Poor |
| > 64% | Very poor |
Recovery after 15 minutes
| < 37% | Very good |
| 37% - 42% | Good |
| 42% - 49% | Fair |
| 49% - 53% | Poor |
| > 53% | Very poor |
Time to 120 bpm
| < 0.9 min | Very good |
| 0.9 min - 1.3 min | Good |
| 1.3 min - 2 min | Fair |
| 2 min - 2.5 min | Poor |
| > 2.5 min | Very poor |
4. Locomotion parameters
When speed increases, the frequency and length of strides increase. However, this increase differs from horse to horse, with some horses preferring increasing their stride length, while others preferring increasing their stride frequency. This depends on each horse's locomotor profile. In addition, the type and quality of the track will have a major impact on stride length and frequency response.
To be able to compare horses with each other, it is important to compare locomotion data at equivalent speeds, e.g. 60 km/h. However, the system may not have recorded data at precisely 60 km/h, and the data doesn't follow a perfect curve; there are local fluctuations. To compensate for this, we use a model to find a mathematical equation linking speed, stride frequency and stride length. This model is calculated from data obtained during phases of acceleration or relatively constant speed, and during phases of trot or canter.
The stride frequency is obtained using an accelerometer and algorithms. We then derive stride length from GPS position and stride frequency, assuming that speed is the product of stride length and stride frequency.
5. Parameter displayed on your platform dashboard
This is an intensity parameter. It compares the intensity of training with that of an equivalent 1600m race.
Comment: This is not an absolute value, but a reference to compare works. It allows you to classify works with each other, providing a visual benchmark.
To find out more about each parameter, you can also move your mouse over the column titles in the Analytics table and an explanation will appear.